Computer Forensics: Investigating Network Intrusions and Cybercrime (CHFI) (2016)
1
Chapter
Network Forensics
and Investigating Logs
Objectives
After completing this chapter, you should be able to:
• Look for evidence
• Perform an end-to-end forensic investigation
• Use log files as evidence
• Evaluate log file accuracy and authenticity
• Understand the importance of audit logs
• Understand syslog
• Understand Linux process accounting
• Configure Windows logging
• Understand NTP
Key Terms
Intrusion detection the process of tracking unauthorized activity using techniques such as
inspecting user actions, security logs, or audit data
Network Time Protocol (NTP) an Internet standard protocol that is used to synchronize the clocks of client computers
Case Example
In August 2005, a Moroccan named Farid Essebar and a Turk named Atilla Ekici were arrested in
their respective home countries on the charges of creating and distributing the Zotob, Rbot, and Mytob worms. It is believed that Essebar wrote the worm code, and Ekici offered him financial
support.
The Mytob worm affected a wide range of Windows systems, including Windows NT, 2000, XP,
and Server 2003. The Zotob worm affected the systems of corporate giants, such as the New York
Times Company, CNN, ABC News, Caterpillar Inc., and General Electric Co.
1-1
1-2
Chapter 1
Within 12 days of the release of the worms, the culprits were arrested. This was possible because of extensive cooperation between Microsoft, the FBI, and the Turkish and Moroccan authorities. It is noteworthy that the investigations crossed international boundaries. It is still unclear whether any other individual or organization was involved in this crime. The United States did not seek extradition of the culprits, as the cyber law differs from country to country. The culprits have been prosecuted in their respective home countries.
Introduction to Network Forensics and Investigating Logs
This chapter focuses on network forensics and investigating logs. It starts by defining network forensics and describing the tasks associated with a forensic investigation. The chapter then covers log files and their use as evidence. The chapter concludes with a discussion about time synchronization.
Network Forensics
Network forensics is the capturing, recording, and analysis of network events in order to discover the source of security attacks. Capturing network traffic over a network is simple in theory, but relatively complex in practice.
This is because of the large amount of data that flows through a network and the complex nature of Internet protocols. Because recording network traffic involves a lot of resources, it is often not possible to record all of the data flowing through the network. An investigator needs to back up these recorded data to free up recording media and to preserve the data for future analysis.
Analyzing Network Data
The analysis of recorded data is the most critical and most time-consuming task. Although there are many automated analysis tools that an investigator can use for forensic purposes, they are not sufficient, as there is no foolproof method for discriminating bogus traffic generated by an attacker from genuine traffic. Human judgment is also critical because with automated traffic analysis tools, there is always a chance of a false positive.
An investigator needs to perform network forensics to determine the type of an attack over a network and to trace out the culprit. The investigator needs to follow proper investigative procedures so that the evidences recovered during investigation can be produced in a court of law.
Network forensics can reveal the following information:
• How an intruder entered the network
• The path of intrusion
• The intrusion techniques an attacker used
• Traces and evidence
Network forensics investigators cannot do the following:
• Solve the case alone
• Link a suspect to an attack
The Intrusion Process
Network intruders can enter a system using the following methods:
• Enumeration: Enumeration is the process of gathering information about a network that may help an intruder attack the network. Enumeration is generally carried out over the Internet. The following information is collected during enumeration:
• Topology of the network
• List of live hosts
• Network architecture and types of traffic (for example, TCP, UDP, and IPX)
• Potential vulnerabilities in host systems
• Vulnerabilities: An attacker identifies potential weaknesses in a system, network, and elements of the network and then tries to take advantage of those vulnerabilities. The intruder can find known vulnerabilities using various scanners.
Log Files as Evidence
1-3
• Viruses: Viruses are a major cause of shutdown of network components. A virus is a software program written to change the behavior of a computer or other device on a network, without the permission or knowledge of the user.
• Trojans: Trojan horses are programs that contain or install malicious programs on targeted systems.
These programs serve as back doors and are often used to steal information from systems.
• E-mail infection: The use of e-mail to attack a network is increasing. An attacker can use e-mail spamming and other means to flood a network and cause a denial-of-service attack.
• Router attacks: Routers are the main gateways into a network, through which all traffic passes.
A router attack can bring down a whole network.
• Password cracking: Password cracking is a last resort for any kind of attack.
Looking for Evidence
An investigator can find evidence from the following:
• From the attack computer and intermediate computers: This evidence is in the form of logs, files, ambient data, and tools.
• From firewalls: An investigator can look at a firewall’s logs. If the firewall itself was the victim, the investigator treats the firewall like any other device when obtaining evidence.
• From internetworking devices: Evidence exists in logs and buffers as available.
• From the victim computer: An investigator can find evidence in logs, files, ambient data, altered configuration files, remnants of Trojaned files, files that do not match hash sets, tools, Trojans and viruses, stored stolen files, Web defacement remnants, and unknown file extensions.
End-To-End Forensic Investigation
An end-to-end forensic investigation involves following basic procedures from beginning to end. The following are some of the elements of an end-to-end forensic trace:
• The end-to-end concept: An end-to-end investigation tracks all elements of an attack, including how the attack began, what intermediate devices were used during the attack, and who was attacked.
• Locating evidence: Once an investigator knows what devices were used during the attack, he or she can search for evidence on those devices. The investigator can then analyze that evidence to learn more about the attack and the attacker.
• Pitfalls of network evidence collection: Evidence can be lost in a few seconds during log analysis because logs change rapidly. Sometimes, permission is required to obtain evidence from certain sources, such as ISPs. This process can take time, which increases the chances of evidence loss. Other pitfalls include the following:
• An investigator or network administrator may mistake normal computer or network activity for
attack activity.
• There may be gaps in the chain of evidence.
• Logs may be ambiguous, incomplete, or missing.
• Since the Internet spans the globe, other nations may be involved in the investigation. This can create legal and political issues for the investigation.
• Event analysis: After an investigator examines all of the information, he or she correlates all of the events and all of the data from the various sources to get the whole picture.
Log Files as Evidence
Log files are the primary recorders of a user’s activity on a system and of network activities. An investigator can both recover any services altered and discover the source of illicit activities using logs. Logs provide clues to investigate. The basic problem with logs is that they can be altered easily. An attacker can easily insert false entries into log files.
1-4
Chapter 1
An investigator must be able to prove in court that logging software is correct. Computer records are not normally admissible as evidence; they must meet certain criteria to be admitted at all. The prosecution must present appropriate testimony to show that logs are accurate, reliable, and fully intact. A witness must authenticate computer records presented as evidence.
Legality of Using Logs
The following are some of the legal issues involved with creating and using logs that organizations and investigators must keep in mind:
• Logs must be created reasonably contemporaneously with the event under investigation.
• Log files cannot be tampered with.
• Someone with knowledge of the event must record the information. In this case, a program is
doing the recording; the record therefore reflects the a priori knowledge of the programmer and
system administrator.
• Logs must be kept as a regular business practice.
• Random compilations of data are not admissible.
• Logs instituted after an incident has commenced do not qualify under the business records exception; they do not reflect the customary practice of an organization.
• If an organization starts keeping regular logs now, it will be able to use the logs as evidence later.
• A custodian or other qualified witness must testify to the accuracy and integrity of the logs. This process is known as authentication. The custodian need not be the programmer who wrote the logging software; however, he or she must be able to offer testimony on what sort of system is used, where the relevant software came from, and how and when the records are produced.
• A custodian or other qualified witness must also offer testimony as to the reliability and integrity of the hardware and software platform used, including the logging software.
• A record of failures or of security breaches on the machine creating the logs will tend to impeach the evidence.
• If an investigator claims that a machine has been penetrated, log entries from after that point are inherently suspect.
• In a civil lawsuit against alleged hackers, anything in an organization’s own records that would tend to exculpate the defendants can be used against the organization.
• An organization’s own logging and monitoring software must be made available to the court so that the defense has an opportunity to examine the credibility of the records. If an organization can show that the relevant programs are trade secrets, the organization may be allowed to keep them secret or to disclose them to the defense only under a confidentiality order.
• The original copies of any log files are preferred.
• A printout of a disk or tape record is considered to be an original copy, unless and until judges and jurors are equipped computers that have USB or SCSI interfaces.
Examining Intrusion and Security Events
As discussed earlier, the inspection of log files can reveal an intrusion or attack on a system. Therefore, monitoring for intrusion and security breach events is necessary to track down attackers. Examining intrusion and security events includes both passive and active tasks. A detection of an intrusion that occurs after an attack has taken place is called a post-attack detection or passive intrusion detection. In these cases, the inspection of log files is the only medium that can be used to evaluate and rebuild the attack techniques. Passive intrusion detection techniques usually involve a manual review of event logs and application logs. An investigator can inspect and analyze event log data to detect attack patterns.
On the other hand, there are many attack attempts that can be detected as soon as the attack takes place.
This type of detection is known as active intrusion detection. Using this method, an administrator or investigator follows the footsteps of the attacker and looks for known attack patterns or commands, and blocks the execution of those commands.
Log Files as Evidence
1-5
Intrusion detection is the process of tracking unauthorized activity using techniques such as inspecting user actions, security logs, or audit data. There are various types of intrusions, including unauthorized access to files and systems, worms, Trojans, computer viruses, buffer overflow attacks, application redirection, and identity and data spoofing. Intrusion attacks can also appear in the form of denial of service, and DNS, e-mail, content, or data corruption. Intrusions can result in a change of user and file security rights, installation of Trojan files, and improper data access. Administrators use many different intrusion detection techniques, including evalua-tion of system logs and settings, and deploying firewalls, antivirus software, and specialized intrusion detection systems. Administrators should investigate any unauthorized or malicious entry into a network or host.
Using Multiple Logs as Evidence
Recording the same information in two different devices makes the evidence stronger. Logs from several devices collectively support each other. Firewall logs, IDS logs, and TCPDump output can contain evidence of an Internet user connecting to a specific server at a given time.
Maintaining Credible IIS Log Files
Many network administrators have faced serious Web server attacks that have become legal issues. Web attacks are generally traced using IIS logs. Investigators must ask themselves certain questions before presenting IIS
logs in court, including:
• What would happen if the credibility of the IIS logs was challenged in court?
• What if the defense claims the logs are not reliable enough to be admissible as evidence?
An investigator must secure the evidence and ensure that it is accurate, authentic, and accessible. In order to prove that the log files are valid, the investigator needs to present them as acceptable and dependable by providing convincing arguments, which makes them valid evidence.
Log File Accuracy
The accuracy of IIS log files determines their credibility. Accuracy here means that the log files presented before the court of law represent the actual outcome of the activities related to the IIS server being investigated. Any modification to the logs causes the validity of the entire log file being presented to be suspect.
Logging Everything
In order to ensure that a log file is accurate, a network administrator must log everything. Certain fields in IIS
log files might seem to be less significant, but every field can make a major contribution as evidence. Therefore, network administrators should configure their IIS server logs to record every field available.
IIS logs must record information about Web users so that the logs provide clues about whether an attack came from a logged-in user or from another system.
Consider a defendant who claims a hacker had attacked his system and installed a back-door proxy server on his computer. The attacker then used the back-door proxy to attack other systems. In such a case, how does an investigator prove that the traffic came from a specific user’s Web browser or that it was a proxied attack from someone else?
Extended Logging in IIS Server
Limited logging is set globally by default, so any new Web sites created have the same limited logging. An administrator can change the configuration of an IIS server to use extended logging.
The following steps explain how to enable extended logging for an IIS Web/FTP server and change the location of log files:
1. Run the Internet Services Manager.
2. Select the properties on the Web/FTP server.
3. Select the Web site or FTP site tab.
4.
Check
the
Enable Logging check box.
5.
Select
W3C Extended Log File Format from the drop-down list.
6.
Go
to
Properties.

1-6
Chapter 1
7.
Click
the
Extended Properties tab, and set the following properties accordingly:
• Client IP address
• User name
• Method
• URI stem
• HTTP status
• Win32 status
• User agent
• Server IP address
• Server port
8.
Select
Daily for New Log Time Period below the general Properties tab.
9. Select Use local time for file naming and overturn.
10. Change the log file directory to the location of logs.
11. Ensure that the NTFS security settings have the following settings:
• Administrators - Full Control
• System - Full Control
Keeping Time
With the Windows time service, a network administrator can synchronize IIS servers by connecting them to an external time source.
Using a domain makes the time service synchronous to the domain controller. A network administrator can synchronize a standalone server to an external time source by setting certain registry entries: Key: HKLM\SYSTEM\CurrentControlSet\Services\W32Time\Parameters\
Setting: Type
Type: REG_SZ
Value: NTP
Key: HKLM\SYSTEM\CurrentControlSet\Services\W32Time\Parameters\
Setting: NtpServer
Type: REG_SZ
Value: ntp.xsecurity.com
UTC Time
IIS records logs using UTC time, which helps in synchronizing servers in multiple zones.
Windows offsets the value of the system clock with the system time zone to calculate UTC time. To check whether the UTC time is correct, a network administrator must ensure that the local time zone setting is accurate. The network administrator must verify that during the process IIS is set to roll over logs using local time.
A network administrator can verify a server’s time zone setting by looking at the first entries in the log file.
If the server is set at UTC –06:00, then the first log entries should appear around 18:00 (00:00 – 06:00 = 18:00).
Because UTC does not follow daylight savings, the administrator must also consider the date. For example, UTC –6:00 will actually be –5:00 half the year.
Log Files as Evidence
1-7
Avoiding Missing Logs
When an IIS server is offline or powered off, log files are not created. When a log file is missing, it is difficult to know if the server was actually offline or powered off, or if the log file was deleted.
To combat this problem, an administrator can schedule a few hits to the server using a scheduling tool. The administrator can keep a log of the outcomes of these hits to determine when the server was active. If the record of hits shows that the server was online and active at the time that log file data is missing, the administrator knows that the missing log file might have been deleted.
Log File Authenticity
An investigator can prove that log files are authentic if he or she can prove that the files have not been altered since they were originally recorded.
IIS log files are simple text files that are easy to alter. The date and time stamps on these files are also easy to modify. Hence, they cannot be considered authentic in their default state. If a server has been compromised, the investigator should move the logs off the server. The logs should be moved to a master server and then moved offline to secondary storage media such as a tape or CD-ROM.
Working with Copies
As with all forensic investigation, an investigator should never work with the original files when analyzing log files. The investigator should create copies before performing any postprocessing or log file analysis.
If the original files are not altered, the investigator can more easily prove that they are authentic and are in their original form. When using log files as evidence in court, an investigator is required to present the original files in their original form.
Access Control
In order to prove the credibility of logs, an investigator or network administrator needs to ensure that any access to those files is audited. The investigator or administrator can use NTFS permissions to secure and audit the log files. IIS needs to be able to write to log files when the logs are open, but no one else should have access to write to these files. Once a log file is closed, no one should have access to modify the contents of the file.
Chain of Custody
As with all forensic evidence, the chain of custody must be maintained for log files. As long as the chain of custody is maintained, an investigator can prove that the log file has not been altered or modified since its capture.
When an investigator or network administrator moves log files from a server, and after that to an offline device, he or she should keep track of where the log file went and what other devices it passed through. This can be done with either technical or nontechnical methods, such as MD5 authentication.
IIS Centralized Binary Logging
Centralized binary logging is a process in which many Web sites write binary and unformatted log data to a single log file. An administrator needs to use a parsing tool to view and analyze the data. The files have the extension .ibl, which stands for Internet binary log. It is a server property, so all Web sites on that server write log data to the central log file.
It decreases the amount of system resources that are consumed during logging, therefore increasing performance and scalability.
The following are the fields that are included in the centralized binary log file format:
• Date
• Time
• Client IP address
• User name
• Site ID
• Server name
• Server IP address
• Server port
1-8
Chapter 1
• Method
• URI stem
• URI query
• Protocol status
• Windows status
• Bytes sent
• Bytes received
• Time taken
• Protocol version
• Protocol substatus
ODBC Logging
ODBC logging records a set of data fields in an ODBC-compliant database like Microsoft Access or Microsoft SQL Server. The administrator sets up and specifies the database to receive the data and log files.
When ODBC logging is enabled, IIS disables the HTTP.sys kernel-mode cache. An administrator must be aware that implementing ODBC logging degrades server performance.
Some of the information that is logged includes the IP address of the user, user name, date, time, HTTP status code, bytes received, bytes sent, action carried out, and target file.
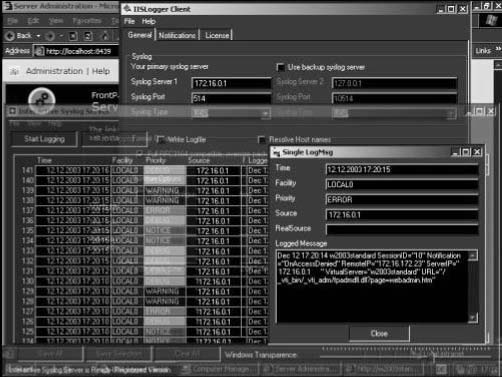
Tool: IISLogger
IISLogger provides additional functionality on top of standard IIS logging. It produces additional log data and sends it using syslog. It even logs data concerning aborted Web requests that were not completely processed by IIS.
IISLogger is an ISAPI filter that is packaged as a DLL embedded in the IIS environment. It starts automatically with IIS. When IIS triggers an ISAPI filter notification, IISLogger prepares header information and logs this information to syslog in a certain format. This occurs each time, for every notification IISLogger is configured to handle.
The following are some of the features of IISLogger:
• It generates additional log information beyond what is provided by IIS.
• It recognizes hacker attacks.
• It forwards IIS log data to syslog.
• It provides a GUI for configuration purposes.
Figure 1-1 shows a screenshot from IISLogger.
Importance of Audit Logs
The following are some of the reasons audit logs are important:
• Accountability: Log data identifies the accounts that are associated with certain events. This data highlights where training and disciplinary actions are needed.
• Reconstruction: Investigators review log data in order of time to determine what happened before and during an event.
• Intrusion detection: Investigators review log data to identify unauthorized or unusual events. These events include failed login attempts, login attempts outside the designated schedules, locked accounts, port sweeps, network activity levels, memory utilization, and key file or data access.
• Problem detection: Investigators and network administrators use log data to identify security events and problems that need to be addressed.
Syslog
Syslog is a combined audit mechanism used by the Linux operating system. It permits both local and remote log collection. Syslog allows system administrators to collect and distribute audit data with a single point of
Log Files as Evidence
1-9
Figure 1-1 IISLogger provides additional IIS logging functionality.
management. Syslog is controlled on a per-machine basis with the file /etc/syslog.conf. This configuration file consists of multiple lines like the following:
mail.info /var/log/maillog
The format of configuration lines is:
facility.level action
The Tab key is used to define white space between the selector on the left side of the line and the action on the right side.
The facility is the operating system component or application that generates a log message, and the level is the severity of the message that has been generated. The action gives the definition of what is done with the message that matches the facility and level. The system administrator can customize messages based on which part of the system is generating data and the severity of the data using the facility and level combination.
The primary advantage of syslog is that all reported messages are collected in a message file. To log all messages to a file, the administrator must replace the selector and action fields with the wildcard (*).
Logging priorities can be enabled by configuring /var/log/syslog. All authorized messages can be logged with priorities such as emerg (highest), alert, crit, err, warning, notice, info, or debug (lowest). Events such as bad login attempts and the user’s last login date are also recorded. If an attacker logs into a Linux server as root using the secure shell service and a guessed password, the attacker’s login information is saved in the syslog file.
It is possible for an attacker to delete or modify the /var/log/syslog message file, wiping out the evidence. To avoid this problem, an administrator should set up remote logging.
Remote Logging
Centralized log collection makes simpler both day-to-day maintenance and incident response, as it causes the logs from multiple machines to be collected in one place. There are numerous advantages of a centralized log collection site, such as more effective auditing, secure log storage, easier log backups, and an increased chance for analysis across multiple platforms. Secure and uniform log storage might be helpful in case an attacker is prosecuted based on log evidence. In such cases, thorough documentation of log handling procedures might be required.
1-10
Chapter 1
Log replication may also be used to audit logs. Log replication copies the audit data to multiple remote-logging hosts in order to force an attacker to break into all, or most, of the remote-logging hosts in order to wipe out evidence of the original intrusion.
Preparing the Server for Remote Logging The central logging server should be set aside to perform only logging tasks. The server should be kept in a secure location behind the firewall. The administrator should make sure that no unnecessary services are running on the server. Also, the administrator should delete any unnecessary user accounts. The logging server should be as stripped down as possible so that the administrator can feel confident that the server is secure.
Configuring Remote Logging The administrator must run syslogd with the -r option on the server that is to act as the central logging server. This allows the server to receive messages from remote hosts via UDP. There are three files that must be changed:
• In the file /etc/rc.d/init.d/syslog, a line reads:
SYSLOGD_OPTIONS=“-m 0”
The administrator must add the -r flag to the options being passed to syslog:
SYSLOGD_OPTIONS=“-m 0 -r”
The -r option opens the syslog daemon port 514 and makes syslog listen for incoming log information.
• In the file /etc/sysconfig/syslog, there is a line similar to the above line. The administrator needs to add the -r flag to this line also.
• The administrator needs to integrate the syslog daemon service into the
/etc/services files. Syslog 514/udp
The administrator must run the following command after altering the three files:
/sbin/service syslog restart
A reference should appear in the var/log/messages file indicating that the remote syslog server is running.
The syslog server can be added to the /etc/syslogd.conf file in the client, which can preserve an audit trail even if a cracker does an rm -rf.
Other servers can be configured to log their messages to the remote server by modifying the action field in the syslog.conf as:
Auth.* @myhost
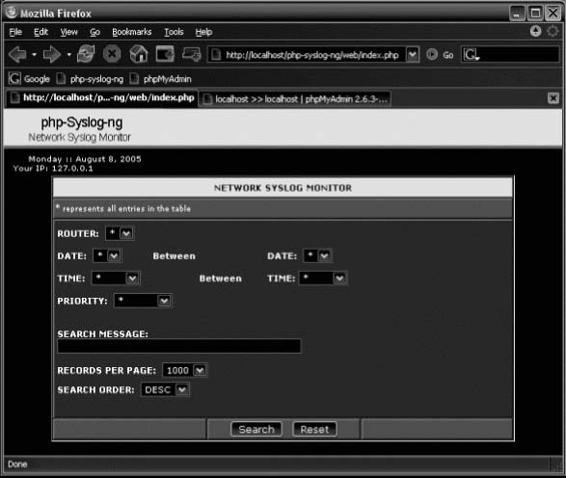
Tool: Syslog-ng
Syslog-ng is a flexible and scalable audit-processing tool. It offers a centralized and securely stored log for all the devices on a network.
The following are some of the features of Syslog-ng:
• It guarantees the availability of logs.
• It is compatible with a wide variety of platforms.
• It is used in heavily firewalled environments.
• It offers proven robustness.
• It allows a user to manage audit trails flexibly.
• It has customizable data mining and analysis capabilities.
• It allows a user to filter based on message content.
Figure 1-2 shows a screenshot from Syslog-ng.
Tool: Socklog
Socklog is a small and secure replacement for syslogd. It runs on Linux (glibc 2.1.0 or higher, or dietlibc), OpenBSD, FreeBSD, Solaris, and NetBSD.
The following are some of the features of Socklog:
• It selects and deselects log entries.
• It has a small code size.
Log Files as Evidence
1-11
Figure 1-2 An administrator can use Syslog-ng to manage logs for all devices on a
network.
• It provides modular and reliable network logging.
• It merges different logs and sorts them in order.
• Log file rotation is based on file size.
• It receives syslog messages from a UNIX domain socket (/dev/log) and writes them to various files on the disk, depending on facility and priority.
• It receives syslog messages from a UDP socket (0.0.0.0:514) and writes them to various files on the disk, depending on facility and priority.
• It writes received syslog messages to a UDP socket (a.b.c.d:514).
The following describes the elements of Socklog:
• The socklog-unix service listens on the UNIX domain socket /dev/log. Usually, this service
replaces syslogd.
• The socklog-inet service listens on the UDP port 0.0.0.0:514. Usually, this service replaces syslogd’s support for remote logging.
• The socklog-klog service reads kernel messages from /proc/kmsg on Linux or /dev/klog on BSD. Usually, this service replaces klogd on Linux or syslogd on BSD.
• The socklog-ucspi-tcp service listens on the TCP port 0.0.0.0:10116; this is a service for Socklog network logging, a different remote logging concept.
• The socklog-notify service handles log event notification and scheduled notification of specified log entries.
1-12
Chapter 1
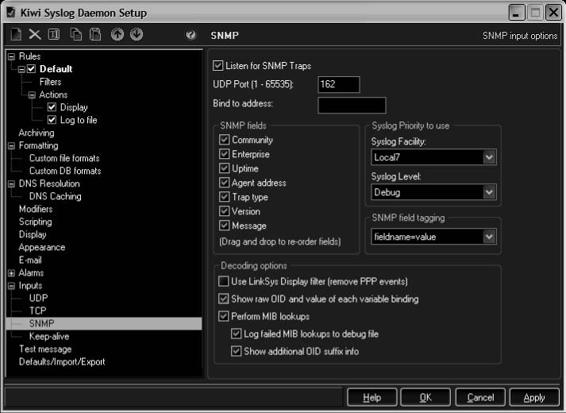
Tool: Kiwi Syslog Daemon
Kiwi Syslog Daemon is a freeware syslog daemon for Windows. It receives logs and displays and forwards syslog messages from routers, switches, UNIX hosts, and any other syslog-enabled device. There are many customizable options available.
Some of the basic features include:
• PIX firewall logging
• Linksys home firewall logging
• SNMP trap and TCP support
• SNMP MIB parsing
• Ability to filter, parse, and modify messages and take actions via VBScript/JScript engine
• GUI-based syslog manager
• Real-time message display as messages are received
• Ten virtual displays for organizing messages
• Message logging or forwarding of all messages, or based on priority or time of day
• Message receipt via UDP, TCP, or SNMP
• Message forwarding via UDP or TCP
• Automatic log file archiving based on a custom schedule
• Messages per hour alarm notification with audible sound or e-mail
• Log file size alarm notification with audible sound or e-mail
• Daily e-mailing of syslog traffic statistics
• Maintenance of source address when forwarding messages to other syslog hosts
• DNS resolution of source host IP addresses with optional domain removal
• DNS caching of up to 100 entries to ensure fast lookups and to minimize DNS lookups
• Preemptive DNS lookups using up to 10 threads
Some of the additional features in the licensed version include:
• Greater flexibility in managing and inspecting log files produced by Kiwi Syslog Daemon, particularly in larger networks
• Additional filtering options for greater and simpler control of subsequent actions
• A large number of additional actions that can be automatically initiated as a result of incoming messages, filters, and rules
• A much larger buffering capacity; this increased capacity greatly increases the scale of the network that can be supported, as well as providing greater reliability in handling peak busy periods or message spikes.
• Additional alarm options
• Priority e-mail support
• Preemptive DNS lookups using up to 200 threads
• Ability to pass values—such as message text, time of message, date of message, host name, facility, level, alarm threshold values, and current syslog statistics—from the received syslog messages to an external program, e-mail message, or syslog message
Figure 1-3 shows the setup screen for Kiwi Syslog Daemon.
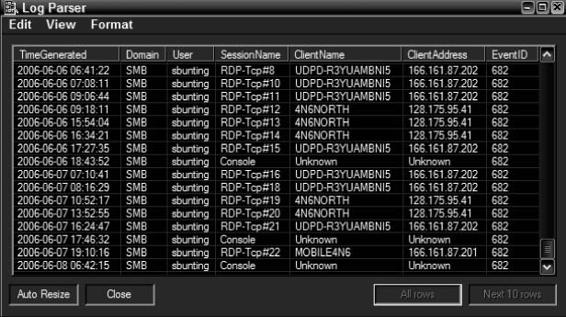
Tool: Microsoft Log Parser
Microsoft Log Parser is a powerful, versatile, robust command-line tool that offers a SQL interface to various log file formats and is fast enough for log file analysis of many Web sites.
Log Files as Evidence
1-13
Figure 1-3 Kiwi Syslog Daemon offers administrators a wealth of customizable options.
The following are some of the features of Microsoft Log Parser:
• It enables a user to run SQL-like queries against log files of any format.
• It produces the desired information either on the screen, in a file, or in an SQL database.
• It allows multiple files to be piped in or out as source or target tables.
• It generates HTML reports and MS Office objects.
• It supports conversion between SQL and CSV formats.
Figure 1-4 shows a screenshot from Log Parser.
Microsoft Log Parser Architecture
Log Parser provides a global query access to text-based data such as IIS log files, XML files, text files, and CSV files, and key data sources like the Windows Event Log, the registry, the file system, user plug-ins, and Active Directory.
All the queries of the log files and key data sources use a common SQL-like syntax.
The following are the supported operating systems for Microsoft Log Parser:
• Windows 2000
• Windows Server 2003
• Windows XP Professional
Tool: Firewall Analyzer
Firewall Analyzer is a Web-based firewall monitoring and log analysis tool that collects, analyzes, and reports information on enterprise-wide firewalls, proxy servers, and RADIUS servers.
1-14
Chapter 1
Figure 1-4 Microsoft Log Parser allows a user to analyze log files using SQL-like
queries.
The following are some of the features of Firewall Analyzer:
• Bandwidth usage tracking
• Intrusion detection
• Traffic auditing
• Anomaly detection through network behavioral analysis
• Web site user access monitoring
• Automatic firewall detection and configuration
• Anomaly filtering
• Historical trend reporting
• Predefined reports
• Customizable reports
• Report scheduling
• Rule-based alerting
• Flexible archiving
• Portability
• Multiplatform support
Figure 1-5 shows a screenshot from Firewall Analyzer.
Tool: Adaptive Security Analyzer (ASA) Pro
Adaptive Security Analyzer (ASA) Pro is a security and threat intelligence application that continuously monitors dynamic, high-volume, heterogeneous security-related data; recognizes and quantifies the extent of event abnormality; and advises security personnel of the factors that contributed most to the event’s classification.
It enables a user to do the following:
• Model security specialist expertise
• Baseline what is normal for a computing environment
• Identify published threats
• Identify activity matching predefined criteria

Log Files as Evidence
1-15
Figure 1-5 This is the main screen of Firewall Analyzer.
• Identify, measure, and prioritize all anomalous events
• Generate root cause insight of threats
• Feed new knowledge back into the system
The following are some of the features of ASA Pro:
• It accelerates threat response.
• It has improved preemptive capabilities.
• It expands resource capacity.
• It maximizes return on security and other IT assets.
• It eliminates information overload.
• It reinforces regulatory compliance.
• It has improved productivity.
Figure 1-6 shows a screenshot from ASA Pro.
Tool: GFI EventsManager
GFI EventsManager collects data from all devices that use Windows event logs, W3C, and syslog, and applies rules and filtering to identify key data. GFI EventsManager also provides administrators with real-time alerting when critical events arise, and it suggests remedial action.
The following are some of the features of GFI EventsManager:
• Network-wide analysis of event logs: GFI EventsManager contains an intelligent event processor that processes logs and available data in a centralized way. It controls and manages Windows event logs, W3C logs, and syslog events.
• Explanations of cryptic Windows events: Cryptic logs make the log analysis process difficult. GFI EventsManager translates these cryptic events into clear and concise explanations.
• Centralized event logging: Event logs can be generated by users or automatically by background processes. These logs are stored in different locations. GFI EventsManager stores all these logs in one SQL
database.

1-16
Chapter 1
Figure 1-6 ASA provides extensive details about security events.
• High-performance scanning engine: GFI EventsManager contains a high-performance event-scanning engine. It is able to scan and collect up to six million events an hour.
• Real-time alerts: GFI EventsManager alerts administrators when it detects any key events or intrusions.
It can send this alert to multiple people by e-mail or SMS.
• Advanced event filtering features: GFI EventsManager’s filtering process sieves through recorded event logs. It allows administrators to select the events they want, without deleting any event from the database.
• Report viewing for key security information happening on the network: GFI EventsManager allows administrators to detect security trends. These standard reports consist of:
• Policy-change reports
• Windows event log system reports
• Event trend reports
• Account usage reports
• Application management reports
• Account management reports
• Object access reports
• Print server reports
How Does GFI EventsManager Work?
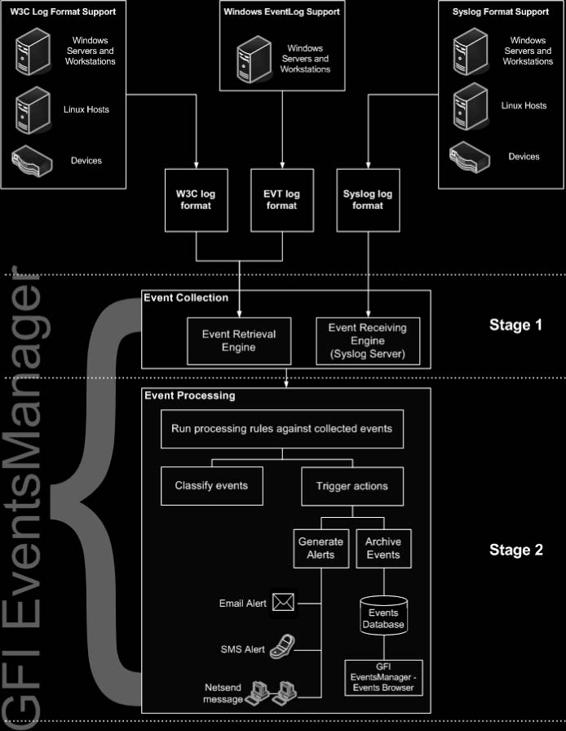
GFI EventsManager divides the events management process in two stages:
• Event collection: GFI EventsManager collects logs from different event sources. This happens with the help of the Event Retrieval Engine and the Event Receiving Engine. The Event Retrieval Engine collects Windows event logs and W3C logs from network log resources. The Event Receiving Engine works as
the syslog server, collecting syslog messages sent by syslog sources.

Log Files as Evidence
1-17
Copyright © by
All rights reserved. Reproduction is strictly prohibited
Figure 1-7 GFI EventsManager manages events in two stages.
• Event processing: In this stage, GFI EventsManager runs a set of event processing rules over the collected events. These rules are the instructions that:
• Analyze the collected event logs and categorize them into critical, low, high, and medium
• Filter events related to particular conditions
• Generate results, triggering e-mail and network alerts concerning key events; according to the results, it starts corrective actions, such as the execution of executable files or scripts in reaction to key events.
Figure 1-7 shows how GFI EventsManager works.
Tool: Activeworx Security Center
Activeworx Security Center is a security information and event management product. Activeworx Security Center monitors security-related events for a variety of devices from one central console. It allows for the discovery of threats, the correlation of relevant security information, and the analysis of vulnerabilities and attacks, and provides intelligence for security personnel to act upon.
Figure 1-8 shows a screenshot from Activeworx Security Center.

1-18
Chapter 1
Figure 1-8 Activeworx Security Center lets an administrator choose which products to
monitor for events.
Linux Process Accounting
Process accounting is an audit mechanism for the Linux operating system. It tracks process execution and logon/
logoff events. It tracks every command that users execute. The process tracking log file can be found in /var/adm,
/var/log, or /usr/adm. Administrators enable the process accounting mechanism using the accton command.
Process accounting logs all the messages in its own binary format to /var/log/psacct. An administrator can view the tracked files using the lastcomm command. The lastcomm command gives information about previously executed commands.
The following lines show example output from lastcomm:
[root@server log]# lastcomm
clear
root
stdout
0.01 secs
Thu Nov 14 07:20
man S
root
stdout
0.00 secs
Thu Nov 14 07:19
sh
root
stdout
0.01 secs
Thu Nov 14 07:19
sh
F
root
stdout
0.00 secs
Thu Nov 14 07:19
less
root
stdout
0.00 secs
Thu Nov 14 07:19
crond F
root
??
0.00 secs
Thu Nov 14 07:20
mrtg S
root
??
1.02 secs
Thu Nov 14 07:20
crond F
root
??
0.00 secs
Thu Nov 14 07:20
sadc S
root
??
0.02 secs
Thu Nov 14 07:20
In this output, the first row stands for the processes executed; a flag follows each process name. The S flag stands for the superuser (root), and the F flag stands for a forked process. Each process should have the following information:
• How the process was executed
• Who executed the process
Log Files as Evidence
1-19
• When the process ended
• Which terminal type was used
The following are the limitations of process accounting:
• It audits the information after the execution of the process.
• It audits only the execution of commands.
Configuring Windows Logging
Windows logging can be configured using Group Policy at the site, domain, organizational unit (OU), or local computer level. Audit policy can be found in Computer Configuration\Windows Settings\Security Settings\
Local Policies\Audit Policy.
Before enabling logging, an administrator needs to keep in mind what needs to be logged; otherwise, over-collection of data can result, making it difficult to trace a critical event.
The following are the events that need to be logged:
• Logging on and logging off
• User and group management
• Security policy changes
• Restarts and shutdowns
An administrator can view each event generated by logging in the Event Viewer, which is automatically started when Windows starts. By default, security logging is not enabled on Windows 2000. Standard users can view only application and system logs. Access to security logs is available only to the system administrator. To ensure that security logs are available, the administrator should turn on security logging.
There are several different logs an administrator needs to examine:
• The application log contains events such as errors, warnings, or information logged by applications.
Event classification is done by event type (severity), with “information” at the low end, “warning” in the middle, and “error” at the highest severity.
• The security log maintains information about the success or failure of audited events.
• The system log contains events generated by system components. It deals with driver failures and hardware issues.
• Domain controllers contain a supplementary log concerning the directory service.
• The File Replication service log has Windows File Replication service events.
• DNS machines contain DNS events in the logs.
Setting Up Remote Logging in Windows
An attacker usually removes any traces left behind after the attack. This is accomplished by deleting the c:\
winnt\system32\config\*.evt file, which erases the event tracking logs. To protect against this, administrators use remote logging. However, unlike Linux, Windows does not support remote logging. An administrator can use a third-party utility like NTsyslog to enable remote logging in Windows. NTsyslog runs as a service under Windows NT 4.0 and Windows 2000. It sends all system, security, and application events to a syslog host.
Tool: NTsyslog
By default, the NTsyslog service runs under the LocalSystem account. The service can also be run as a local if that user is given the right to log on as a service and manage auditing and security logs.
NTSyslogCtrl is a GUI tool that an administrator can use to configure which messages to monitor and the priority to use for each type. By default, sending all messages utilizes the user alert priority.
This GUI tool is used for configuring the registry. To configure the syslog host manually, an administrator can create the following registry entry:
[HKEY_LOCAL_MACHINE\SOFTWARE\SaberNet] “Syslog” = “host.domain.com”
An administrator can specify the syslog host by domain name or by IP address.

1-20
Chapter 1
Figure 1-9 An administrator can choose which events to forward to a syslog host using
NTsyslog.
For redundancy, an administrator can specify an additional host by creating the following registry key:
[HKEY_LOCAL_MACHINE\SOFTWARE\SaberNet]“Syslog1” = “backup.domain.com”
Figure 1-9 shows a screenshot from NTsyslog.
Tool: EventReporter
EventReporter is a tool that processes Windows event logs, parses them, and forwards the results to a central syslog server. EventReporter automatically monitors Windows event logs. It detects system hardware and software failures that damage the network. EventReporter integrates Windows systems with UNIX-based management systems.
The following are the important features of EventReporter:
• Monitoring
• Filtering
• Data collection
• Alerting
Multiple Windows event logs are allowed and are monitored by EventReporter. Event log information can be delivered through e-mail. Syslog facilities are supported. It produces an alert sound when information is received over the Internet.
Tool: EventLog Analyzer
EventLog Analyzer is a Web-based syslog and event log management solution that collects, analyzes, archives, and reports on event logs from distributed Windows hosts and syslogs from UNIX hosts, routers, switches, and other syslog devices.
The following are some of the features of EventLog Analyzer:
• Event archiving
• Automatic alerting
• Predefined event reports
• Historical trending

Why Synchronize Computer Times?
1-21
Figure 1-10 This shows the main screen of EventLog Analyzer.
• Centralized event log management
• Security analysis
• Automated event archiving
• Importing event logs
• Real-time alerting
• Scheduled reporting
• Multiple report export formats
• Compliance reporting
• Host grouping
• Built-in database
Figure 1-10 shows a screenshot from EventLog Analyzer.
Why Synchronize Computer Times?
When an administrator is investigating intrusion and security events that involve multiple computers, it is essential that the computers’ clocks be synchronized. If computers’ clocks are not synchronized, it becomes almost impossible to accurately correlate actions that are logged on different computers. If the clocks on these computers are not accurate, it also becomes difficult to correlate logged activities with outside actions.
What Is NTP?
NTP stands for Network Time Protocol. It is an Internet standard protocol (built on top of TCP/IP) that is used to synchronize the clocks of client computers. NTP sends time requests to known servers and obtains server time stamps. Using those stamps, it adjusts the client’s time.
1-22
Chapter 1
The following are some of the features of NTP:
• It is fault tolerant and dynamically autoconfiguring.
• It synchronizes accuracy up to one millisecond.
• It can be used to synchronize all computers in a network.
• It uses UTC time.
• It is available for every type of computer.
NTP Stratum Levels
Stratum levels determine the distance from the reference clock. A reference clock is stratum-0 equipment that is considered to be accurate and has little delay. The reference clock matches its time with the correct UTC time using long-wave radio signals, GPS transmissions, CDMA technology, or other time signals, such as WWV
and DCF77.
Stratum-0 servers are not directly used on the network. They are directly connected to computers that work as stratum-1 servers. Higher stratum levels are connected to stratum-1 servers over a network path; therefore, stratum-2 servers get their time from stratum-1 servers through NTP over a network link. In the same way, stratum-3 servers get their time from stratum-2 servers, and so on.
Depending on the reference clock of a stratum-1 time server, its accuracy to UTC can be within less than one millisecond (ms).
Figure 1-11 shows the different NTP stratum levels and how they are related.
NTP Stratum Levels
Stratum 0
Stratum 1
Direct Connection
(e.g. RS-232)
Network Connection
NTP
Stratum 2
Stratum 3
Copyright © by
All rights reserved. Reproduction is strictly prohibited
Figure 1-11 Stratum-0 NTP servers are directly connected to stratum-1 servers, which are then connected to stratum-2 servers over the network.
Why Synchronize Computer Times?
1-23
NTP Time Servers
The following tables list NTP time servers. The tables are provided as reference only. This list is not intended to be comprehensive. Any NTP time server selection should be evaluated to determine if the server in question meets specific time server requirements.
Server Name
IP Address
Location
time-a.nist.gov
129.6.15.28
NIST, Gaithersburg, Maryland
time-b.nist.gov
129.6.15.29
NIST, Gaithersburg, Maryland
time-a.timefreq.bldrdoc.gov
132.163.4.101
NIST, Boulder, Colorado
time-b.timefreq.bldrdoc.gov
132.163.4.102
NIST, Boulder, Colorado
time-c.timefreq.bldrdoc.gov
132.163.4.103
NIST, Boulder, Colorado
utcnist.colorado.edu
128.138.140.44
University of Colorado, Boulder
time.nist.gov
192.43.244.18
NCAR, Boulder, Colorado
time-nw.nist.gov
131.107.1.10
Microsoft, Redmond, Washington
nist1.dc.certifiedtime.com
216.200.93.8
Abovnet, Northern Virginia
nist1.datum.com
209.0.72.7
Datum, San Jose, California
nist1.nyc.certifiedtime.com
208.184.49.129
Abovnet, New York City
nist1.sjc.certifiedtime.com
207.126.103.202
Abovnet, San Jose, California
Table 1-1 This is a list of time servers maintained by NIST
Server Name
IP Address
Location
Service Area
usno.pa-x.dec.com; CNAME:
204.123.2.72
Palo Alto, CA: Systems Research U.S. Pacific and Mountain time
navobs1.pa-x.dec.com
Center, Compaq Computer
zones
Corp.
timekeeper.isi.edu
128.9.176.30
Marina del Rey, CA: USC
CalRen2 and Los Nettos region
Information Sciences Institute
tock.usno.navy.mil, tick.usno.
192.5.41.41, 192.5.41.40
Washington, DC: U.S. Naval
NSFNET
navy.mil
Observatory
time.chu.nrc.ca
Ottawa, Ontario, Canada:
Canada
National Research Council of
Canada
terrapin.csc.ncsu.edu
152.1.58.124
Raleigh, NC: North Carolina
Southeastern U.S.
State University
bitsy.mit.edu
18.72.0.3
Cambridge, MA: MIT
NSFNET and NEARnet area
Information Systems
bonehed.lcs.mit.edu
18.26.4.105
Cambridge, MA: MIT
Eastern U.S.
clock.isc.org
192.5.5.250
Palo Alto, CA: Internet
BARRnet, Alternet-west, and
Software Consortium
CIX-west
clock.osf.org
130.105.4.59
Cambridge, MA: Open
NSFNET and NEARnet region
Software Foundation
clock.via.net
209.81.9.7
Palo Alto, CA: ViaNet
Communications
lerc-dns.lerc.nasa.gov
128.156.1.43
Cleveland, OH: Lewis Research
NSFNET and OARNET
Center (NASA)
navobs1.usnogps.navy.mil,
204.34.198.40, 204.34.198.41
Colorado Springs, CO: Schriever U.S. Pacific and Mountain time
CNAME: tick.usnogps.navy.
AFB
zones
mil; navobs2.usnogps.navy.mil,
CNAME: tock.usnogps.navy.mil
navobs1.wustl.edu, CNAME:
128.252.19.1
St. Louis, MO: Washington
U.S. Central time zone
tick.wustl.edu
University
Table 1-2 This is a list of stratum-1 time servers
( continues)
1-24
Chapter 1
Server Name
IP Address
Location
Service Area
ncnoc.ncren.net
192.101.21.1
Research Triangle Park, NC:
NC-REN region
MCNC
ntp-cup.external.hp.com
192.6.38.127
Cupertino, CA: HP
West Coast U.S.
ntp1.delmarva.com
138.39.7.20
Newark, DE: Conectiv
Cable & Wireless Network
Communications
(formerly MCInet)
otc1.psu.edu
128.118.46.3
University Park, PA: Penn State
NSFNET, PREPNET, and JvNCnet
University
vega.cbk.poznan.pl
150.254.183.15
Borowiec, Poland:
Poland and Europe
Astrogeodynamical
Observatory, Space Research
Centre
Time2.Stupi.SE
192.36.143.151
Stockholm, Sweden: Stupi AB
Europe
time.ien.it
193.204.114.1
Torino, Italy: IEN Galileo
Italy and Europe
Ferraris
swisstime.ethz.ch
129.132.2.21
Zurich, Switzerland: Integrated
Switzerland and Europe
Systems Lab, Swiss Fed. Inst. of
Technology
tempo.cstv.to.cnr.it
150.145.33.1
Torino, Italy: CSTV of National
Italy and Europe
Research Council
ntp0.fau.de, ntp1.fau.de, ntp2
Erlangen, Germany: University
Germany and Europe
.fau.de, ntps1-0.uni-erlangen
Erlangen-Nuernberg
.de, ntps1-1.uni-erlangen.de,
ntps1-2.uni-erlangen.de
ntps1-0.cs.tu-berlin.de,
130.149.17.21, 130.149.17.8
Berlin, Germany: Technische
Germany and Europe
ntps1-1.cs.tu-berlin.de
Universitaet Berlin
ntps1-1.rz.Uni-Osnabrueck.DE
131.173.17.7
Germany
Germany and Europe
Time1.Stupi.SE
192.36.143.150
Sweden
SUnet and NORDUnet Sweden
clock.cuhk.edu.hk
137.189.6.18
Hong Kong: The Chinese
Hong Kong, China, and
University of Hong Kong
Southeast Asia
clock.nc.fukuoka-u.ac.jp,
133.100.9.2, 133.100.11.8
Fukuoka, Japan: Fukuoka
Japan and Pacific area
clock.tl.fukuoka-u.ac.jp
University
ntp.cs.mu.OZ.AU
128.250.36.2
Melbourne Australia: The
Australia and New Zealand
University of Melbourne
Table 1-2 This is a list of stratum-1 time servers continued
Server Name
IP Address
Location
Service Area
ntp1.cmc.ec.gc.ca,
Quebec, Canada: Canadian
Eastern Canada
ntp2.cmc.ec.gc.
Meteorological Center
time.chu.nrc.ca; time.nrc.ca
Ontario, Canada: National
Canada
Research Council of Canada
timelord.uregina.ca
142.3.100.15
Saskatchewan, Canada:
Canada
University of Regina
tick.utoronto.ca,
Ontario, Canada: University of
Eastern Canada
tock.utoronto.ca
Toronto
ntp2a.audiotel.com.mx,
Mexico: Audiotel office
Avantel, MCINet, and Mexico
ntp2c.audiotel.com.mx,
ntp2b.audiotel.com.mx
ns.scruz.net
165.227.1.1
Santa Cruz, CA: Scruz-net, Inc.
Western U.S.
ntp.ucsd.edu
132.239.254.49
San Diego, CA: UCSD Academic
CERFNET, NSFNET, SDSC region,
Computing Services/Network
and nearby
Operations
Table 1-3 This is a list of stratum-2 time servers
Why Synchronize Computer Times?
1-25
Server Name
IP Address
Location
Service Area
ntp1.mainecoon.com,
Quincy, CA
North America
ntp2.mainecoon.com
louie.udel.edu
128.175.1.3
Newark, DE: University of
CAIRN, Abilene, and vBNS
Delaware
ntp.shorty.com
Atlanta, GA: CNSG
Southeastern U.S.
rolex.peachnet.edu,
Kennesaw, GA: PeachNet
PeachNet (Georgia) and
timex.peachnet.edu
southeastern U.S.
ntp-0.cso.uiuc.edu, ntp-1.cso
Urbana-Champaign, IL:
CICNET, Midwest, and NCSA
.uiuc.edu, ntp-2.cso.uiuc.edu
University of Illinois
region
ntp-1.mcs.anl.gov,
Chicago, IL: Argonne National
NSF/ANSNet, CICNet,
ntp-2.mcs.anl.gov
Laboratory
NetIllinois, and ESNet
gilbreth.ecn.purdue.edu,
West Lafayette, IN: Purdue
NSFNET and CICNET area
harbor.ecn.purdue.edu,
University
molecule.ecn.purdue.edu
ntp1.kansas.net,
199.240.130.1, 199.240.130.12
Manhattan, KS: KansasNet
Central U.S. and Great Plains
ntp2.kansas.net
OnLine Services
timeserver.cs.umb.edu
158.121.104.4
Boston, MA: UMass-Boston CS
New England
dept.
ns.nts.umn.edu,
Minneapolis/St. Paul, MN:
CICNET region
nss.nts.umn.edu
University of Minnesota
everest.cclabs.missouri.edu
128.206.206.12
Columbia, MO: University of
MOREnet
Missouri-Columbia
allison.radiks.net
205.138.126.83
Omaha, NE: Radiks Internet
Midwest U.S.
Access
cuckoo.nevada.edu
131.216.1.101
Las Vegas, NV: University of
NevadaNet, NSFNET, and SDSC
Nevada System Computing
region
Services
tick.cs.unlv.edu,
Las Vegas, NV: UNLV College of
Sprintnet
tock.cs.unlv.edu
Engineering
ntp.ctr.columbia.edu
New York, NY: Columbia
Sprintlink and NYSERnet
University
ntp0.cornell.edu
192.35.82.50
Ithaca, NY: Cornell University
NSFNET and NYSER region
sundial.columbia.edu
New York, NY: Morningside
NYSERnet
Campus, Columbia University
timex.cs.columbia.edu
New York, NY: Columbia
PSINET, NSFNET, and NYSER
University Computer Science
region
Department
constellation.ecn.uoknor.edu
129.15.22.8
Norman, OK: University of
Midnet
Oklahoma
tick.koalas.com
207.48.109.6
Coos Bay, OR: Koala Computers
Northwestern U.S.
clock.psu.edu
128.118.25.3
University Park, PA: Penn State
Internet2, vBNS, CERFnet (AT&T
University
IP Services), PSC/NCNE, and
CASC
fuzz.psc.edu
128.182.58.100
Pittsburgh, PA: Pittsburgh
NSFNET and PSC region
Supercomputing Center
ntp-1.ece.cmu.edu,
Pittsburgh, PA: Carnegie
PREPNET and PSC region
ntp-2.ece.cmu.edu
Mellon Electrical and Computer
Engineering
ntp.cox.smu.edu
129.119.80.126
Dallas, TX: Cox School of
NSFNET and SESQUI region
Business, Southern Methodist
University
ntp.fnbhs.com
209.144.20.76
Hughes Springs, TX: First
Northeastern Texas
National Bank
Table 1-3 This is a list of stratum-2 time servers
( continues)
1-26
Chapter 1
Server Name
IP Address
Location
Service Area
ntp.tmc.edu
128.249.1.10
Houston, TX: Baylor College of
NSFNET and SESQUI region
Medicine
ntp5.tamu.edu
165.91.52.110
College Station, TX: Texas A&M NSFNET, SESQUI region,
University
THEnet, and TAMUSDSN
tick.greyware.com,
Plano, TX: Greyware
South-central U.S.
tock.greyware.com
Automation Products
ntp-1.vt.edu, ntp-2.vt.edu
Blacksburg, VA: Virginia Tech
Southeastern U.S.
Computing Center
ntp.cmr.gov
140.162.1.3
Arlington, VA: Center for
NSFNET and SURA region
Seismic Studies
clock.tricity.wsu.edu
192.31.216.30
Richland, WA: Washington
NSFNET and NorthWestNet
State University
time.ultimeth.net
Washington, U.S.: Mill Creek
Northwestern U.S.
ntp1.cs.wisc.edu,
Madison, WI: Computer Science U.S. and any
ntp2.cs.wisc.edu,
Department, University of
ntp3.cs.wisc.edu
Wisconsin-Madison
tick.nap.com.ar,
200.49.40.1, 200.49.32.1
Buenos Aires, Argentina:
Argentina
tock.nap.com.ar
Network Access Point
time.sinectis.com.ar
Buenos Aires, Argentina:
Argentina
Sinectis S.A.
ntp.cais.rnp.br
200.144.121.33
Brazil: Brazilian Research
Brazil
Network
ntp.linux.org.ve
150.185.192.250
Venezuela: VELUG, Grupo de
Arica
Usuarios Linux de Venezuela
bernina.ethz.ch
129.132.98.11
Zurich, Switzerland: Swiss Fed.
Switzerland and Europe
Inst. of Technology
clock.netcetera.dk,
Copenhagen, Denmark, Europe
Denmark, Scandinavia, and
clock2.netcetera.dk
Northern Europe
slug.ctv.es
Spain: Altea
Spain
tick.keso.fi, tock.keso.fi
Pieksamaki, Finland: Keski-
Finland
Savon Oppimiskeskus
ntp.obspm.fr
Meudon, France: Observatoire
France and Europe
de Paris-Meudon
ntp.univ-lyon1.fr
Lyon, France: CISM
France, Switzerland, Italy, and
Europe
ntp.via.ecp.fr
138.195.130.70
Paris, France: VIA, Ecole
France and Europe
Centrale
time.kfki.hu
148.6.0.1
Budapest, Hungary: KFKI
HUNGARNET
Research Institute for Particle
and Nuclear Physics
ntps.net4u.it
195.32.52.129
Vercelli, Italy: Net4u Srl
Italy
fartein.ifi.uio.no
129.240.64.3
Oslo, Norway: University of
NORDUnet
Oslo
time.alcanet.no
Oslo, Norway: Alcanet
Europe
International
info.cyf-kr.edu.pl
149.156.4.11
Krakow, Poland: Academic
Poland and Europe
Computer Centre
ntp.lth.se
130.235.20.3
Lund, Sweden: Lund Institute
Sweden and NORDUnet
of Technology
biofiz.mf.uni-lj.si
193.2.69.11
Ljubljana, Slovenia: Institute
Slovenia and Europe
of Biophysics, University of
Ljubljana
Table 1-3 This is a list of stratum-2 time servers continued
Why Synchronize Computer Times?
1-27
Server Name
IP Address
Location
Service Area
hmljhp.rzs-hm.si
Ljubljana, Slovenia:
Slovenia and Europe
Hydrometeorological Institute
of Slovenia
ntp1.arnes.si, ntp2.arnes.si
Ljubljana, Slovenia: Academic
Slovenia and Europe
and Research Network of
Slovenia
time.ijs.si
Ljubljana, Slovenia: J. Stefan
Slovenia and Europe
Institute
ntp.cs.tcd.ie, ntp.maths.tcd.ie,
Dublin, Ireland: School of
Ireland and U.K.
ntp.tcd.ie
Mathematics, Trinity College
ntp.cs.strath.ac.uk
Glasgow, Scotland: Strathclyde
U.K., Europe, and any
University
ntp0.uk.uu.net, ntp1.uk.uu.net,
Cambridge, U.K.
UUNET (formerly known in the
ntp2.uk.uu.net
U.K. as PIPEX) and U.K.
ntp2a.mcc.ac.uk,
Manchester, England:
U.K.
ntp2b.mcc.ac.uk,
University of Manchester
ntp2c.mcc.ac.uk,
ntp2d.mcc.ac.uk
tick.tanac.net
Buckinghamshire U.K.: Wibble
U.K.
U.K., Aylesbury
ntp.landau.ac.ru
193.233.9.7
Moscow, Russia: Landau
Russia
Institute for Theoretical Physics
ntp.psn.ru
194.149.67.130
Russia: Pushchino (near
Russia
Moscow)
sign.chg.ru
193.233.46.10
Chernogolovka, Russia:
Russia
Chernogolovka Scientific
Center (near Moscow)
ntp.cyber-fleet.net
203.139.30.195
Tokyo, Japan: Cyber Fleet, Inc.
Japan and East Asia
time.nuri.net
Seoul, Korea: Inet, Inc.
Korea, Japan, Hong Kong, and
East Asia
truechimer.waikato.ac.nz,
Hamilton, New Zealand: The
New Zealand
truechimer1.waikato.ac.nz,
University of Waikato
truechimer2.waikato.ac.nz,
truechimer3.waikato.ac.nz
ntp.shim.org
Singapore and the Philippines
Singapore
ntp.supernet300.com
Lagos, Nigeria: Supernet300
Western Africa (primarily
Nigerian NITEL backbone)
ntp.cs.unp.ac.za
143.128.82.200
Pietermaritzburg, South Africa:
South Africa
Natal University
augean.eleceng.adelaide.edu.au, 129.127.28.4, 129.127.40.3,
Adelaide, South Australia: The
AARNet
ntp.adelaide.edu.au
203.21.37.18
University of Adelaide
time.esec.com.au
203.21.84.4
Carlton, Victoria, Australia:
eSec Limited
Table 1-3 This is a list of stratum-2 time servers
Configuring the Windows Time Service
To configure Windows time service to use an internal hardware clock, follow these steps:
1.
Click
Start, click Run, type regedit, and then click OK.
2.
Locate and then click on the registry subkey HKEY LOCAL MACHINE\SYSTEM\CurrentControlSet\
Services\W32Time\Parameters.
3.
In
the right pane, right-click ReliableTimeSource, and then click Modify.
1-28
Chapter 1
4. In Edit DWORD Value, type 1 in the Value data box, and then click OK.
5.
Locate and then click on the registry subkey HKEY LOCAL MACHINE\SYSTEM\CurrentControlSet\
Services\W32Time\Parameters.
6. In the right pane, right-click LocalNTP, and then click Modify.
7. In Edit DWORD Value, type 1 in the Value data box, and then click OK.
8. Quit Registry Editor.
9.
At the command prompt, run the net stop w32time && net start w32time command to restart the Windows time service.
10.
“Run the w32tm -s command on all computers other than the time server to reset the local computer’s time against the time server.”
Chapter Summary
■ Syslog is a combined audit mechanism used by the Linux operating system.
■ Centralized binary logging is a process in which multiple Web sites send binary and unformatted log data to a single log file.
■ Linux process accounting tracks the commands that each user executes.
■ Monitoring intrusion and security events includes both passive and active tasks.
■ A key component of any computer security system is regular review and analysis of both certain standard system log files, as well as the log files created by firewalls and intrusion detection systems.
■ NTP is an Internet standard protocol (built on top of TCP/IP) that assures accurate synchronization to the millisecond of computer clock times in a network of computers.
■ NTP stratum levels define the distance from the reference clock.
Review Questions
1. List the steps to implement central logging.
___________________________________________________________________________________________
___________________________________________________________________________________________
2. Explain end-to-end forensic investigation.
___________________________________________________________________________________________
___________________________________________________________________________________________
3. What do you understand about remote logging?
___________________________________________________________________________________________
___________________________________________________________________________________________
4. What is the importance of synchronized time?
___________________________________________________________________________________________
___________________________________________________________________________________________

Hands-On Projects
1-29
5. Explain Linux process accounting.
___________________________________________________________________________________________
___________________________________________________________________________________________
6. What is the importance of audit logs?
___________________________________________________________________________________________
___________________________________________________________________________________________
7. Describe event gathering.
___________________________________________________________________________________________
___________________________________________________________________________________________
8. How can you examine intrusion and security events?
___________________________________________________________________________________________
___________________________________________________________________________________________
9. Explain how to configure the Windows Time service.
___________________________________________________________________________________________
___________________________________________________________________________________________
10. List the different log analysis tools.
___________________________________________________________________________________________
___________________________________________________________________________________________
Hands-On Projects
1. Run the tool Syslog-ng and see the results.
2. Run the tool Adaptive Security Analyzer (ASA) Pro and see the results.
3. Download the tool Swatch from http://swatch.sourceforge.net/. Run and monitor current server logs.
4. Set up remote logging in Windows with the help of NTsyslog.
5. Run the tool EventReporter and monitor the event logs in Windows.
This page intentionally left blank

All materials on the site are licensed Creative Commons Attribution-Sharealike 3.0 Unported CC BY-SA 3.0 & GNU Free Documentation License (GFDL)
If you are the copyright holder of any material contained on our site and intend to remove it, please contact our site administrator for approval.
© 2016-2026 All site design rights belong to S.Y.A.